
Architecture
Telemetry and Analytics — OpenTelemetry as the vendor-neutral instrumentation standard, with CMCD, CMSD, OpenMetrics, and 5GMS Data Collection for media-specific measurements. A central Telemetry Hub aggregates QoS, QoE, and QoI (energy/sustainability) data.
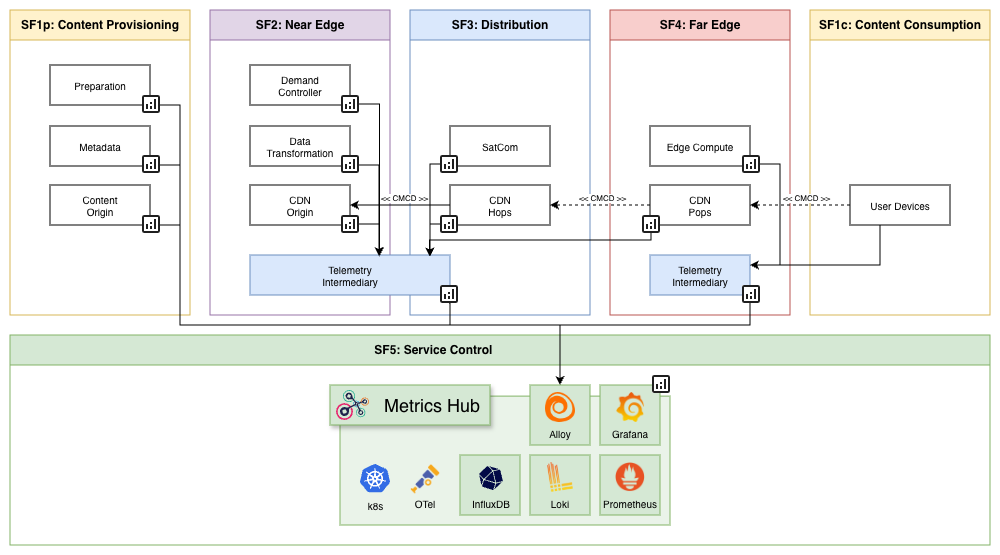 Telemetry collection and aggregation to the Telemetry Hub.
Ingestion Overview
Telemetry reaches the platform by four routes. Two are OTLP endpoints that components send to; two are collectors that read from an AWS service on a schedule or an event. All four converge on Alloy, which fans traces to Tempo, logs to Loki and metrics to Prometheus and InfluxDB, with Grafana reading across them.
 Figure: Telemetry ingest. Solid routes enter through an OTLP gateway; dashed routes read from AWS and cross a module boundary to do it.
| Route | Module | Entry point | Identity |
|---|---|---|---|
| Keyed OTLP gateway | Telemetry | Envoy on :8080/:8081, authorised by an external auth service |
Pre-shared key, stamped as x-component-id |
| Open OTLP gateway | Telemetry | POST /open/<signal>/<owner>/<name> |
Taken from the URL path; no key |
| CloudWatch collector | Telemetry | Polls /aws/ log groups every 60 seconds |
None — the collector reads directly |
| CDN log collectors | Media streaming | S3 object notification via SQS | None — the collector reads directly |
The two collector routes do not pass through an OTLP endpoint, so the identity, rate-limiting and authorisation applied at the gateways do not apply to them. They also cross a module boundary in opposite directions: the CloudWatch collector sits in the Telemetry module but reads log groups belonging to other modules, while the CDN log collectors sit in Media Streaming and write into the Telemetry module's own components. Bringing both onto the same front door used by partner components is an open architectural question rather than a settled design.
Known Ingestion Path
Gcore and CloudFront CDN logs containing CMCD are ingested by two OpenTelemetry Collector deployments running in the otel-collector namespace of the core-eks cluster. Ingestion is event-driven rather than scheduled: each log file written to S3 raises an ObjectCreated notification onto an SQS queue, which the collector consumes by long polling.
 Figure: CDN log ingestion. Two lanes share one pattern — S3, event notification, SQS, collector — then split: parsed logs leave over OTLP/gRPC to Alloy, which forwards them to Loki; derived metrics go straight to Prometheus.
Parsing happens inside the collector, not downstream. OTTL transforms split each access log line into fields, promote them to OpenTelemetry semantic conventions, and extract the CMCD (CTA-5004) client state carried on the request. A count connector then derives request-count metrics from the parsed records across a bounded set of low-cardinality dimensions; high-cardinality fields such as session and content identifiers are deliberately left in the logs rather than becoming metric labels.
The two outputs leave by different routes:
- Logs go over OTLP/gRPC to Alloy, which forwards them to Loki. Alloy performs no transformation on these records — the parsing has already happened upstream of it.
- Metrics go directly to Prometheus over remote write, deliberately bypassing Alloy. Alloy's Prometheus exporter discards the first Delta sample of each new series, which would silently lose the first data point of every new label combination.
Grafana reads from both repositories.
This path is verified against the infrastructure code that deploys it, as of 2026-09-21. What remains open is ownership, failure handling, and the handoff from the media streaming pipelines into the Telemetry module. The CloudFront lane routes messages to a dead-letter queue after three failed receives; the Gcore lane's queue is owned by a separate component and its failure behaviour has not been confirmed here.
Telemetry Repositories
- Prometheus — metrics.
- Loki — logs.
- Tempo — traces.
- InfluxDB — deployed but not actively used by a current service.
Grafana is the primary dashboard and evidence surface. A Popularity API is also required so partners such as Varnish can consume telemetry-derived output.
Inventory and Readiness
The Global Component Registry data is the canonical inventory of components and telemetry classifications published on this site. GCR means Global Component Registry and must not be confused with Gcore, the CDN provider.
See MS3 Readiness for source-by-source status, known gaps, and immediate actions.